found the existing earnings tracker hard to use
Case study 01 · Fintech · Web + mobile
Funding, made easier to understand.
Investia is an inventory financing platform for Kickfurther. It connects businesses seeking capital with buyers who evaluate and back inventory opportunities.
- Role
- Design lead, guided by the creative director
- Focus
- Onboarding, dashboards, and data visualization
- Scope
- Research, UX, UI, mobile MVP, web, and handoff
- Team
- Design, product, engineering, and client stakeholders
Nominated for the International UX Design Awards 2023
Explore interactive prototypeOne systemTwo sides of the market
200%
increase in the new-user rate during the first two months
40%
reduction in the cost of acquiring business users
Recognition
International UX Design Awards 2023 nominee
01 · Brief
A complex product had to work for two different mindsets.
Buyers needed to compare opportunities, understand risk, and track returns. Businesses needed to manage funding, invoices, payments, and compliance. New users required guidance while experienced users wanted speed.
The goal included a mobile MVP, a redesigned web dashboard, brand foundations, and a design system that could support the product after handoff.
02 · Process
Five stages, with evidence carried forward.
- 01
Discover
Stakeholder kickoff, business goals, constraints
- 02
Research
Survey, interviews, competitive review
- 03
Ideate
Audiences, user stories, priority flows
- 04
Design + prototype
Wireframes, UI, prototypes, design system
- 05
Test + iterate
Usability testing, iteration, handoff
03 · Discover + research
Find the friction before drawing the interface.
Kickoff sessions with stakeholders, developers, and engineers established the scope. A client questionnaire clarified business goals. A competitive review examined how adjacent financing products structured dashboards and high-intent actions.
The team then surveyed 20 participants and interviewed four people between 25 and 45, including new and experienced small business owners and individual investors.
Optional depth
Open the parts of the research process you want to inspect.
01Kickoff and client brief+
Kickoff sessions brought stakeholders, developers, engineers, and design into the same conversation. A client questionnaire then made the underlying scope explicit.
- Create a mobile MVP that could introduce more users to the platform.
- Bring clearer navigation and new capabilities to the existing web dashboard.
- Establish brand foundations and a reusable product design system.
- Reduce the perceived complexity of a financial product for first-time and experienced users.
02Competitive review+
We reviewed adjacent funding and finance experiences to understand how established products handled hierarchy, tracking, and explanation.
- Kickstarter showed how a restrained dashboard can prioritize the most important information.
- Amazon financing demonstrated the value of simple surfaces for powerful financial tracking.
- Onramp Funds showed how education and page structure can support acquisition.
03Survey and interview setup+
The study included a survey with 20 participants and interviews with four people between 25 and 45. Participants included new and experienced small business owners and individual investors.
- Earnings and payout tracking
- Comprehension of available data and analytics
- Navigation, page structure, and confidence in the next action
04How evidence changed the scope+
The evidence separated the platform into two primary audiences: buyers backing inventory and businesses seeking funding. That distinction shaped the priority flows and the level of guidance each surface needed.
- Make status and progress visible before asking people to act.
- Add context around financial figures instead of showing data alone.
- Use one product language across onboarding, dashboards, and opportunity detail.
struggled to understand the available data and analytics
wanted more intuitive navigation and page structure
04 · Define
Structure the work around real goals, not a list of screens.
Research separated the experience into two core audiences: buyers investing in inventory and businesses seeking inventory funding. User stories turned their goals into priorities, then flows exposed where verification, funding, and recovery states needed more guidance.
I led the onboarding flows and dashboard work while coordinating with fellow designers so both sides of the platform shared one product language.
Flow evidence
Map the system before polishing screens.
These flows translated research into navigation, account states, recovery paths, and handoffs across the two-sided platform. The information architecture then gave those decisions a durable home.
05 views
05 · Product direction
Turn status into guidance.
Orient
Make account status, progress, and the next action visible without asking users to interpret the whole system.
Explain
Pair financial figures with context so people can understand what changed and why it matters.
Scale
Use one visual language across buyer and business workflows, from mobile onboarding to dense web dashboards.
06 · Mobile MVP
Teach the model while people use it.
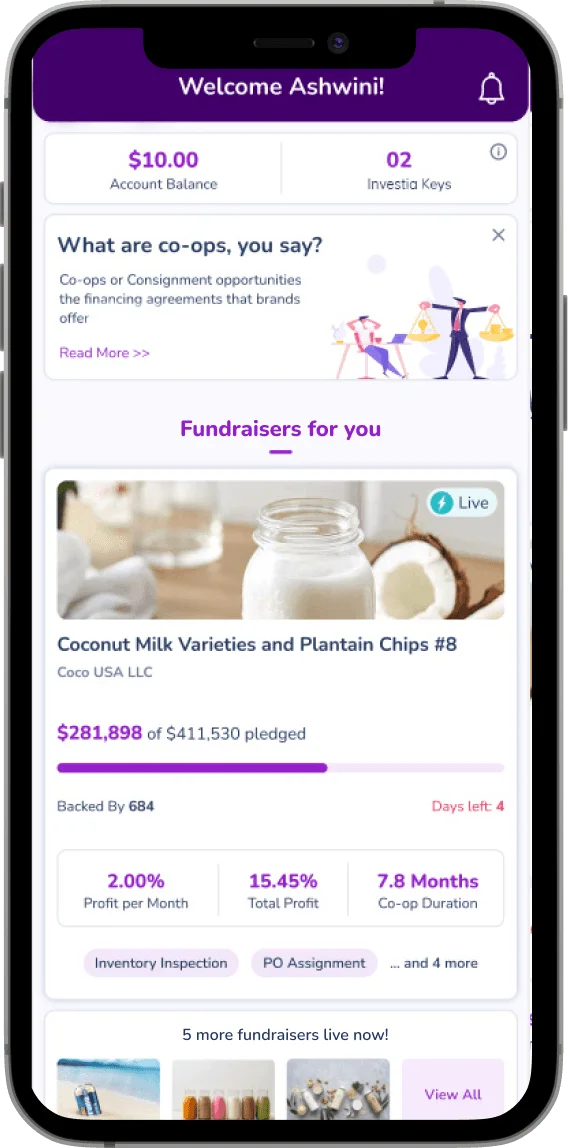
The mobile experience combined progressive onboarding, account context, educational prompts, opportunity discovery, and investment tracking. This gave first-time buyers a way into the model without slowing down returning users.
02 views
07 · Responsive web
Dense information, with a clear path through it.
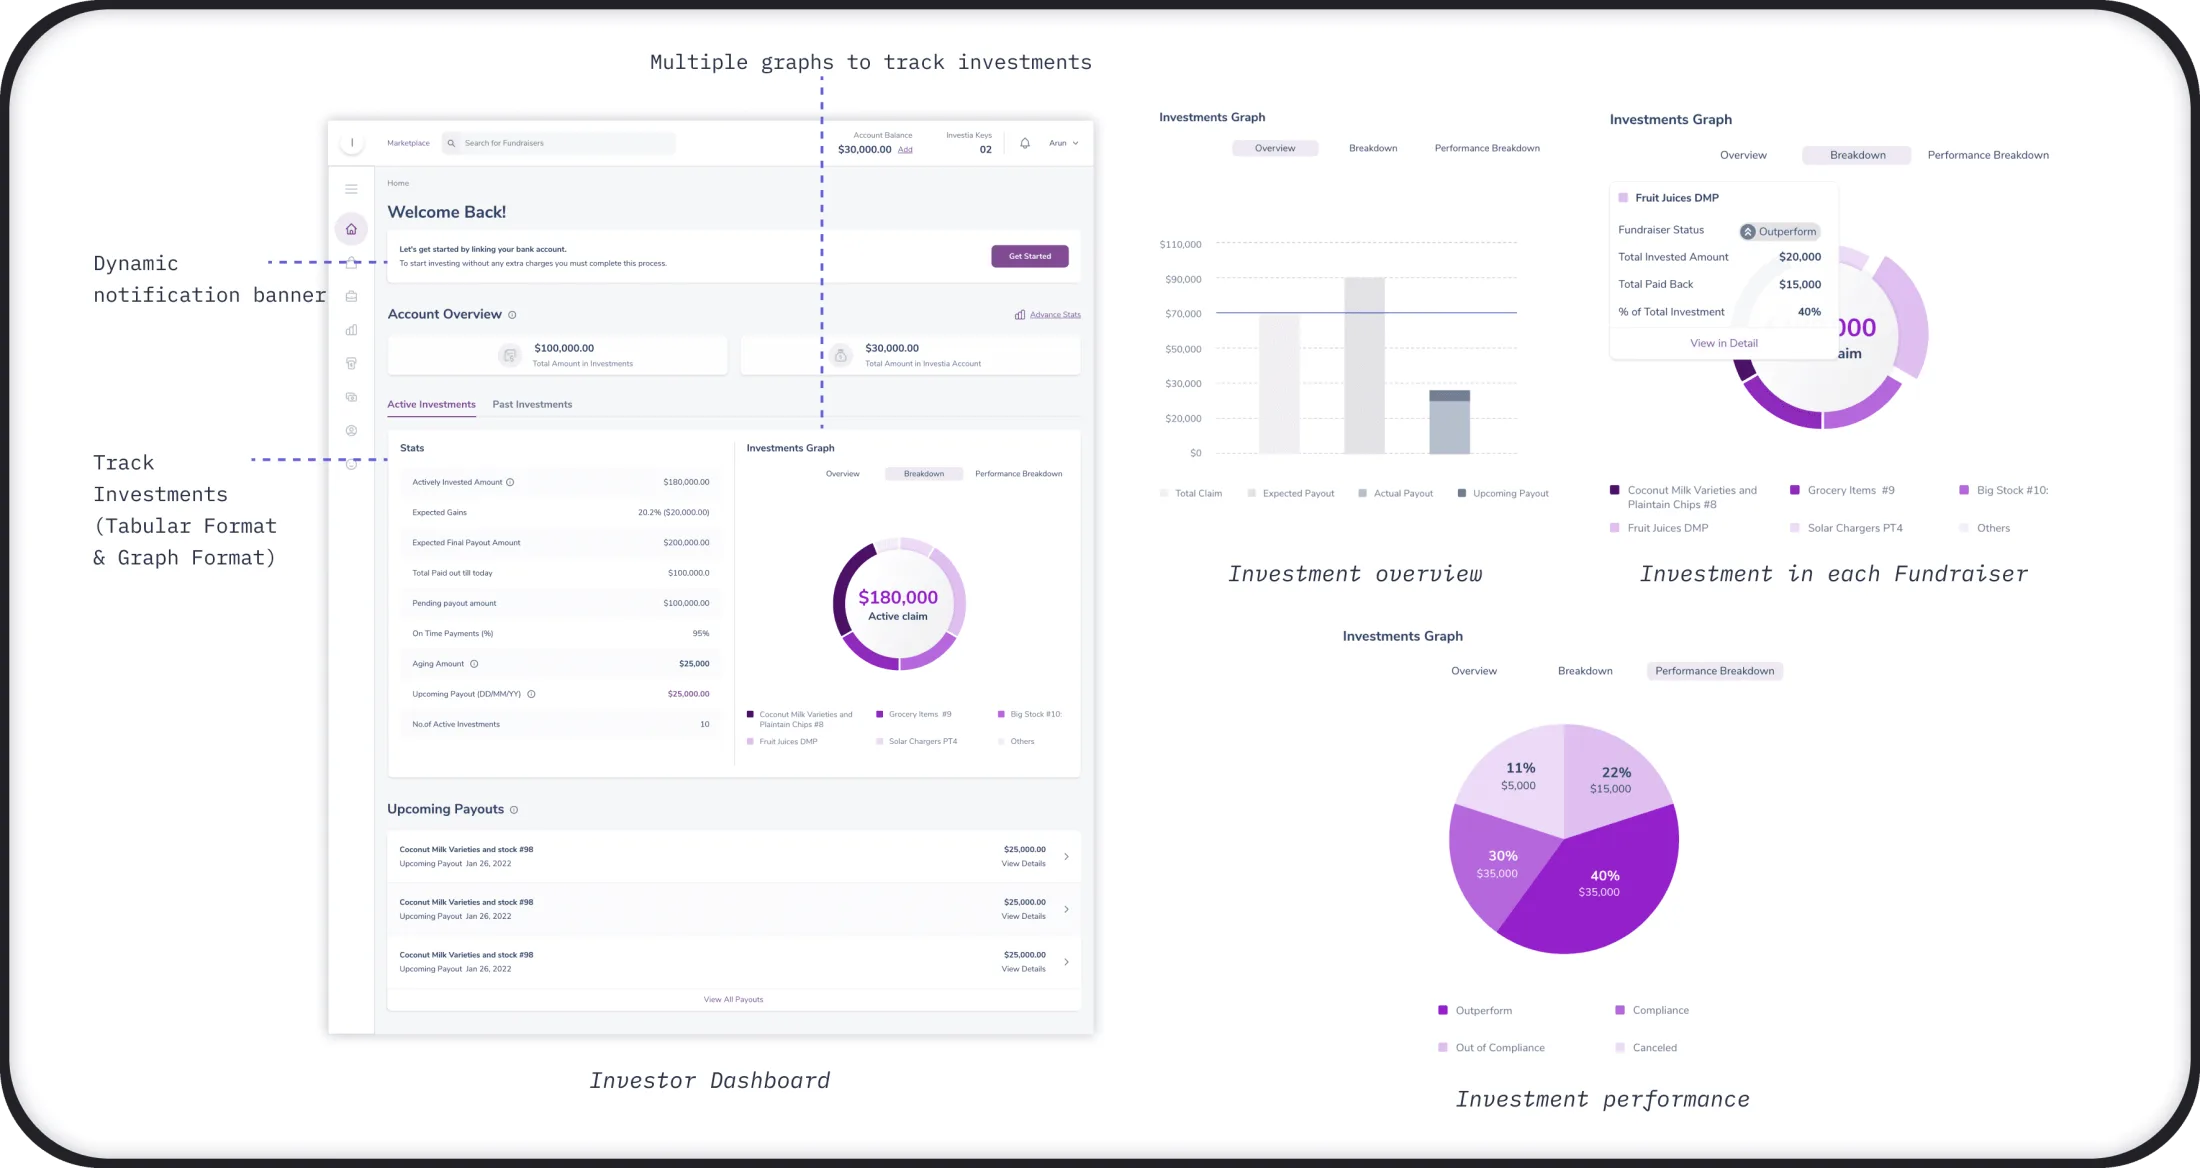
Web dashboards were reorganized around the questions people asked most often: What is happening, what does it mean, and what should I do next? The result connected payments, performance, onboarding, and opportunity evidence without flattening important financial detail.
04 views
08 · Data visualization
Show the summary. Keep the evidence close.
I worked with developers to select chart patterns that were clear for users and practical to build. Tabular values supported precise reading, while visual breakdowns helped people scan investment performance and upcoming payouts.
09 · Design system
Consistency had to survive the handoff.
Because the existing brand guidance was limited, we built an atomic design system for color, typography, icons, controls, product states, data visualization, spacing, and layout. Accessibility checks and interaction states made the system useful to engineering, not only to design.
07 views
10 · Validate + handoff
Test the decisions, then document the behavior.
Usability testing checked whether participants could understand the redesigned dashboard and complete an investment in the expected number of steps. The team iterated from feedback, then annotated screens, measurements, and states for engineering.
of participants reported being very happy with the new dashboard
completed the tested investing flow within the estimated steps
Outcome · Clarity compounds
International UX Design Awards2023 nominee
“His user-centric thinking and design skills were instrumental for the duration of this work, which was over a year. I'd recommend Arun for any complex project.”
Scott McKay · CTO, Kickfurther